Vortex Studio 2017b: Introducing the Director Panel
Authorcmlabs
Published
2017-08-23
Vortex Studio 2017b introduces the Director panel, a new window within the Vortex Studio Player. This feature helps integrators configure and monitor simulator applications on a distributed system. For end users, it provides a panel with a tray icon that gives the status of the simulator and its associated applications, as well as monitoring capabilities (see images below). This is an important step towards increased ease of use and configurability for Vortex Studio simulators . Configuring and Launching Simulators The new Director panel enables the user to create and configure simulator files that contain the description of a simulator:
Which machines of the network are used
Which application nodes are running, and where
Name of the machine and folder path to a central data store
Which network will be used for this simulator
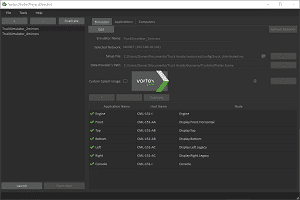
Director Interface
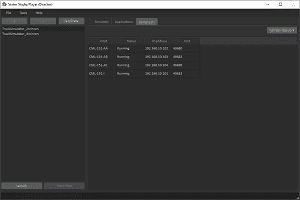
Computers tab
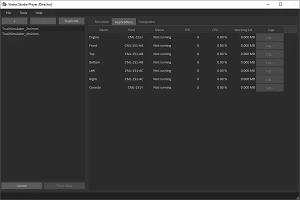
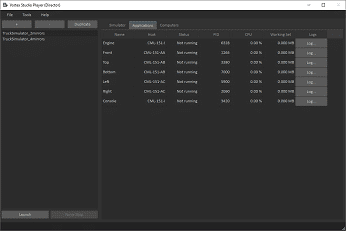
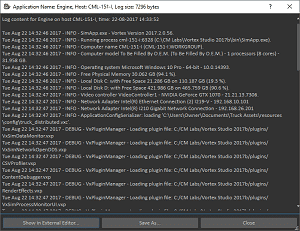
In the left image above (“Director Interface”), a list of available simulators can be managed and selected, then started or stopped. Computers of a given network are also discovered and errors validated when editing (See checkmarks above). The selected simulator can be edited in order to add more applications, select nodes in the setup file, modify the network adapter, etc. The “launch” function can be called in a command line so that deployed turnkey simulators used by operators don’t have to go through the Director panel to start their simulation. The user experience has not changed compared to previous versions of Vortex Studio, apart from an additional monitoring panel. A list of computers available can be displayed in order to check their availability with regards to the network selected (see “Computers tab” image to the right). Monitoring the Status of Simulation Applications Once the simulator has started, the usual simulation windows appear either on the local machine or on the remote machines. Monitoring of the remote applications can be performed using the Applications tab of the Director panel. The screenshot below shows the monitoring panel opened from the tray after launching Vortex Player on a local network. It reports the following information that might help when troubleshooting the simulator:
Actual machine and process ID
Status and errors
CPU consumption
Memory consumption
Log files of the remote running application
Monitoring Panel
It also reports when an application stops unexpectedly. The user can open the log to investigate the cause, or report it to support.
Applications Tab
Director Log
Over the next weeks, we’ll talk about additional features of the new Vortex Studio 2017b release (get it here).